At Kubermatic we’re making extensive use of Prow, Kubernetes’ own CI/CD framework, for our public and private projects. Prow is responsible for managing source code builds which are usually triggered by creating Pull Requests (PRs) on our GitHub repositories or sometimes periodically for nightly cleanup jobs. Besides just running build jobs, it can also act as a fully-featured GitHub bot for performing manual tasks or merging PRs once a certain set of criteria is met.
As with any Kubernetes cluster, monitoring is essential. If your developers are having an especially productive day, the workload on your cluster increases and jobs slow down. They now start to influence each other, compete for resources and once things get slower (god help you if your system would swap), you run into random timeouts, tests become flaky and developer happiness is reduced.
Prow itself does offer a rudimentary, web-based UI to see the pending and running jobs and, most importantly, inspect a job’s logs in case of errors. This however is not really useful for monitoring your cluster over time (and it’s not meant to be a long-term statistic), so we recently spent some time on improving our setup and decided to share the results.
The Basics
Our Prow setup consists of two separate Kubernetes clusters: the control plane and the worker cluster. The control plane runs, as its name implies, the Prow control plane. These components have access to GitHub credentials and so we decided to separate it from the actual build workload, which runs on the “worker cluster”. Prow does offer some native metrics, but this article only covers data that we can scrape inside the worker cluster.
For monitoring the control plane itself, there is already some prior art used by the Kubernetes project itself. But once again, this focuses on runtime metrics of the control plane and not really the resource usage of our workers.
The monitoring setup is as simple as it gets: We’re using the Prometheus Operator to deploy the stack for us and then just inject a couple of custom Prometheus rules and Grafana dashboards. If you already have a monitoring stack running, you can skip the operator and just use the metrics from kube-state-metrics.
Setup
Installing Prow is out of scope for this article, so please refer to the well written installation instructions for more information on that topic. For the rest of this article we’re assuming you have set up Prow and configured your KUBECONFIG variable to point to your cluster.
The first step is to install Helm’s Tiller (Helm is a Kubernetes package manager and we will use it to make installing additional software easier) into the cluster. To be a good cluster citizen we’re creating a dedicated service account for Tiller, even though we will give it cluster-admin permissions anyway:
$ kubectl create serviceaccount -n kube-system tiller
$ kubectl create clusterrolebinding tiller-cluster-role --clusterrole=cluster-admin --serviceaccount=kube-system:tiller
$ helm --service-account tiller --tiller-namespace kube-system init
Now that Tiller is hopefully running, we can install the vanilla [Prometheus Operator chart](https://github.com/helm/charts/tree/master/stable/prometheus-operator) (in the real world you would probably make a healthy amount of adjustments to the operator) into a new monitoring namespace:
$ helm --tiller-namespace kube-system install --namespace monitoring --name prometheus-operator stable/prometheus-operator
Give your cluster a bit of time and you should soon see a handful of pods running:
$ kubectl -n monitoring get pods
NAME                                                     READY  STATUS   RESTARTS  AGE
alertmanager-prometheus-operator-alertmanager-0          2/2    Running  0         3h15m
prometheus-operator-grafana-779cbbd695-x87mm             2/2    Running  4         3h15m
prometheus-operator-kube-state-metrics-6f7cdf99cd-bvxww  1/1    Running  0         3h15m
prometheus-operator-operator-56fc8d5b58-rlsj7            1/1    Running  0         3h15m
prometheus-operator-prometheus-node-exporter-4pzfs       1/1    Running  0         3h15m
prometheus-operator-prometheus-node-exporter-5tt7g       1/1    Running  0         3h15m
prometheus-operator-prometheus-node-exporter-6d6m6       1/1    Running  0         3h15m
prometheus-operator-prometheus-node-exporter-6m2dr       1/1    Running  0         3h15m
prometheus-operator-prometheus-node-exporter-7h8gl       1/1    Running  0         3h15m
prometheus-operator-prometheus-node-exporter-9m99f       1/1    Running  0         3h15m
prometheus-operator-prometheus-node-exporter-gcpwp       1/1    Running  0         3h15m
prometheus-operator-prometheus-node-exporter-hhh95       1/1    Running  0         3h15m
prometheus-operator-prometheus-node-exporter-j44kk       1/1    Running  0         3h15m
prometheus-operator-prometheus-node-exporter-mf5np       1/1    Running  0         3h15m
prometheus-operator-prometheus-node-exporter-rmfrs       1/1    Running  0         3h15m
prometheus-operator-prometheus-node-exporter-smxbk       1/1    Running  0         3h15m
prometheus-operator-prometheus-node-exporter-tql7j       1/1    Running  0         3h15m
prometheus-prometheus-operator-prometheus-0              3/3    Running  1         3h4m
Prow jobs run as regular Kubernetes pods in a namespace you choose when setting up Prow. In our setup, we’re using the default namespace. Kube-state-metrics will now already publish all the metrics we need for our dashboards: Prow puts a bunch of metadata into labels onto the pods, so for a basic monitoring setup it’s sufficient to rely on those metrics. More data is available inside the control plane cluster and you could also write a dedicated Prow Exporter, but for now the existing metrics are plenty.
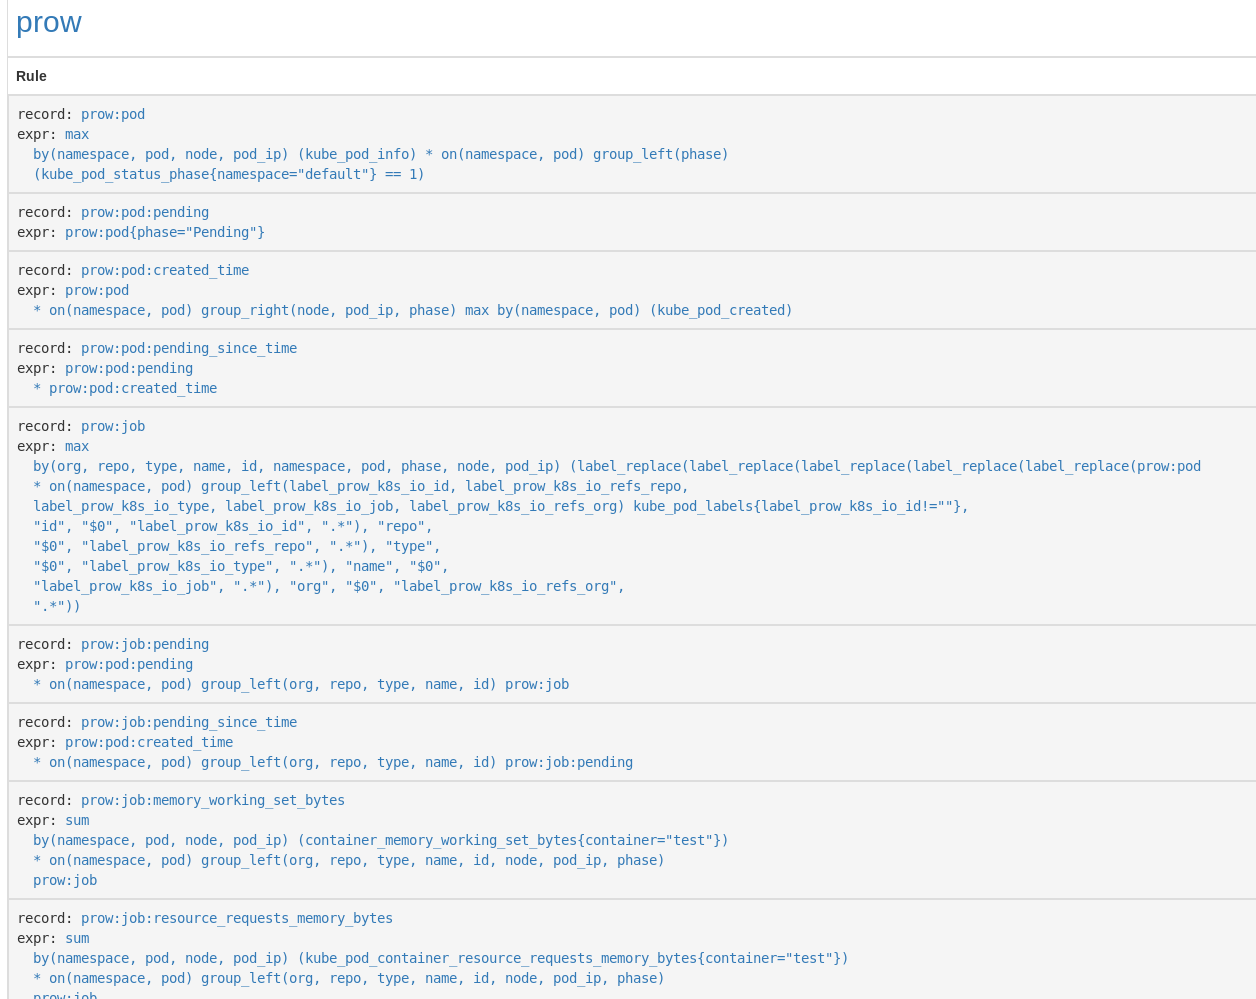
However, the plentiful metrics are hard to use and can lead to slow queries. We would have to merge pod labels, status, job labels and resource metrics on the fly. Not something we want on a dashboard that re-runs the same queries over and over again. Instead we’re going to define a set of recording rules for Prometheus to create neat, tidy metrics that can be easily visualized.
When using the Prometheus Operator, new rules can be defined by creating a PrometheusRules resource containing the rules:
apiVersion: monitoring.coreos.com/v1
kind: PrometheusRule
metadata:
  name: prow-rules
  namespace: monitoring
  labels:
    app: prometheus-operator
    release: prometheus-operator
spec:
  groups:
  - name: prow
    rules:
    # These metrics are based on generic pods, not just Prow jobs.

    # group interesting information into a single metric
    # squash metrics from multiple kube-state-metrics pods
    # {namespace="...",pod="...",node="...",pod_ip="1.2.3.4",phase="..."} 1
    - record: prow:pod
      expr: |
        max by (namespace, pod, node, pod_ip) (kube_pod_info) *
          on (namespace, pod)
          group_left (phase)
          (kube_pod_status_phase{namespace="default"} == 1)
(The full set of rules is available on GitHub.)
Note that we filtered not only the pods by namespace, but also only took node named worker-… into account for calculating node resource usage. Depending on your setup, you might want to tweak the rules a bit. Afterwards, apply the new rules using kubectl
$ kubectl -n monitoring apply -f prometheus-rules.yaml
and then port-forward into your Prometheus to make sure the rules have been loaded successfully (open http://127.0.0.1:9090/rules after running this command):
$ kubectl -n monitoring port-forward prometheus-prometheus-operator-prometheus-0 9090
You should be able to see the new prow group and its rules:
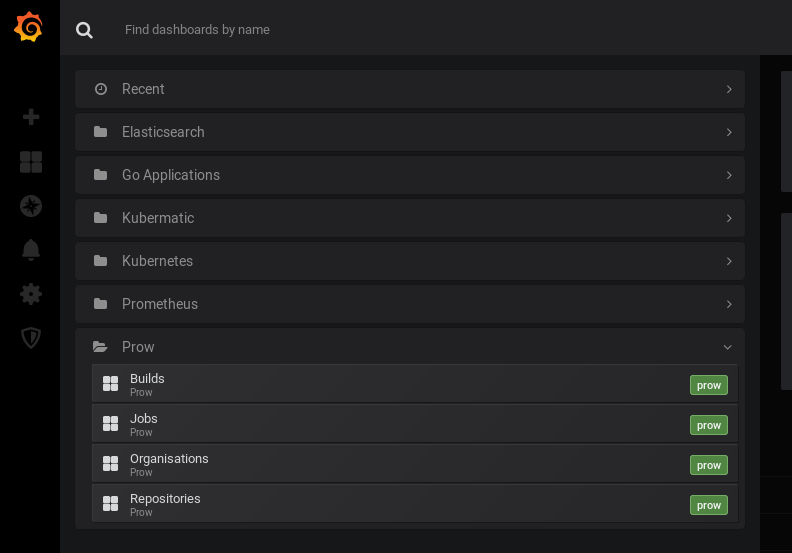
The final step is to create a set of handy dashboards to allow our developers a quick overview over the available and consumed resources. Adding custom dashboards is straightforward: Create a new ConfigMap, put each dashboard as a JSON file in it, label it with grafana_dashboard=1 and it will be picked up automatically. The GitHub repository linked above has a ready-made ConfigMap in it, so let’s apply it:
$ kubectl -n monitoring apply -f dashboards-configmap.yaml
Profit!
After all this you should be able to see four new dashboards labelled with “prow” in your Grafana.
You can reach Grafana just like Prometheus by doing a port-forwarding:
$ kubectl -n monitoring port-forward service/prometheus-operator-grafana 3000
The dashboards are ordered hierarchically: You go from organisations to repositories to jobs and finally to individual builds. For a single company the Repositories dashboard is a good starting point:
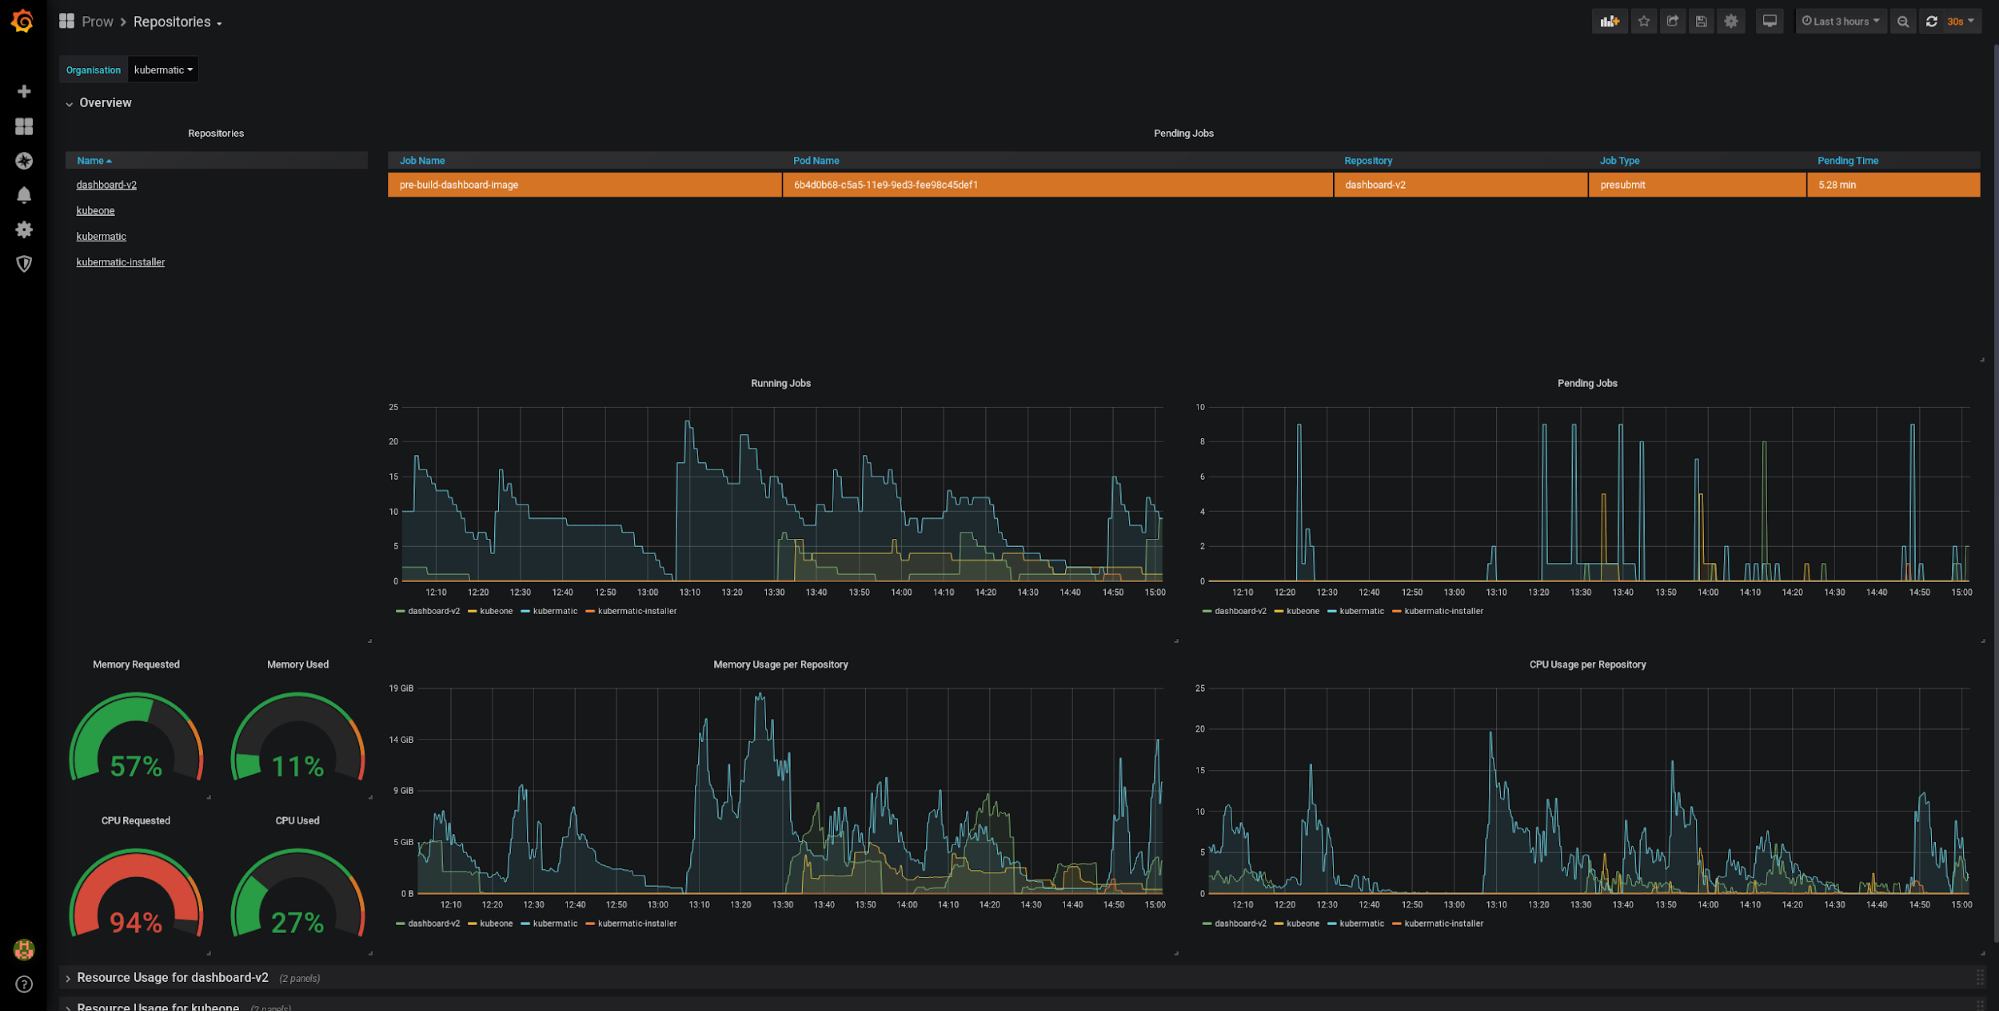
The top left has a list of repositories, which you can use to drill down further. The top has a table listing all jobs (of the chosen organisation) that are stuck in pending. In a perfect world, this table is always empty. Below are charts giving an overview over the running jobs and resource consumption. The gauges on the left contrast the requests to their actual usage. In this sense, the two gauges on the left can go above 100% (indicating that you request more resources than the cluster has available), whereas the two gauges on the right should never exceed 100%. Below that are rows for each repository where the resources are broken down individually, allowing you to easily judge the repository’s resource constraints.
All configurations and dashboards are available on GitHub under the Apache License.
Learnings
There are a couple of things we’ve learned over time, most importantly that good resource requests are essential to prevent your cluster from overloading itself. This is of course true for any healthy Kubernetes cluster, but the spotty nature of CI workloads amplifies the importance of resource scheduling. Using the dashboards it’s easy to get a good feeling for how much resources a job usually takes and adjust the requests accordingly.
The screenshot below shows what can happen if requests are set too high. If you plan for the worst case and set high requests, it’s very possible that you underuse your cluster and waste developer time because jobs are needlessly waiting their turn. If you see patterns like in the image on the left, consider reducing your resource requests.
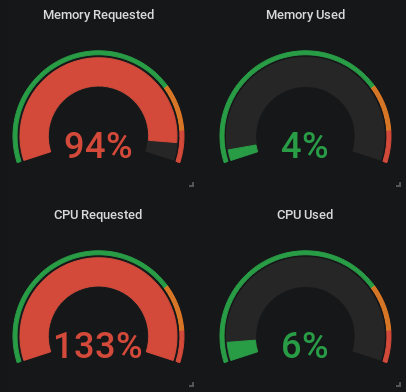
A common reason for running into this situation are jobs that are very spotty in the CPU usage, for example when running end-to-end tests against remote environments. In such tests most of the build time is spent just waiting for conditions to be met, but intermittently a lot of CPU is required for building binaries or Docker images before or after tests. The image below shows how the resource request is set to 0.5 CPU cores, but the container is allowed to spike and use up to 2 cores.
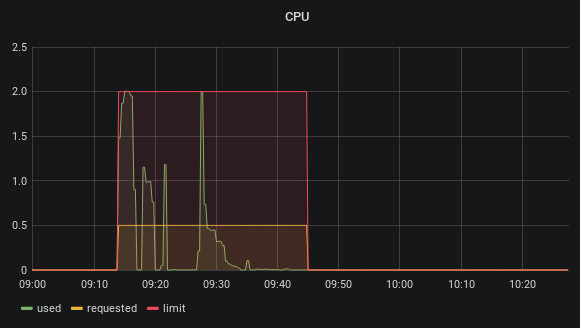
The resource requests for builds should target the average resources needed, not the maximum, or else you will run into congestion issues. Assume that spotty jobs are not all requiring their resources at the same time.
With resource limits the story is more complicated. Jobs should always have proper memory limits, just like with every other pod we ever deploy into any Kubernetes cluster. CPU limits are not so easy. While it’s tempting to also set limits according to the average usage, this will artificially slow down your jobs if the nodes would have capacity to spare. Not having a limit at all could let jobs interfere with cluster services like log shippers, the kubelet or others.
For us it worked well to have limits close the node capacity (like 3.5Gi on a machine with 4GiB memory). If your jobs are not timing-sensitive (for example if you mainly compile artifacts or run only unit tests), it’s okay if multiple jobs run on the same node: the operating system will take care of scheduling between them and your build artifacts will take a bit longer to produce. If your jobs however depend on external services or you run end-to-end tests, having a process be slowed down can lead to timeouts and flaky tests. In this case we made sure to set high enough CPU requests to prevent multiple sensitive jobs from running on a single node.
All in all the new dashboards gave us a much better feeling for the resources our build jobs actually consume. It made the data not just available to the cluster operators, but to all the teams actually using the cluster.
On the Horizon
Many of the lessons on what constitutes interesting metrics will make their way into Kubermatic Kubernetes Platform’s monitoring stack in future releases, helping cluster operators plan according to their projected needs.
Due to our separate clusters the Grafana dashboards do not yet have access to the Prow-internal metrics. We plan on installing a dedicated Prometheus instance into the control plane cluster and federate the data over into the worker cluster, as we still like the approach of having a monitoring setup in the “less privileged” cluster.
The existing metrics can also be used to define proper, actionable alerts, for example when the job queue size for an organisation or repository exceeds a certain threshold. The metrics could also be used for triggering custom auto scaling solutions if needed. Thanks to setting proper resource requests and having pods actually be pending, existing cluster autoscalers like that on Google’s Kubernetes Engine (GKE) can easily be triggered to accommodate increased usage.


